

Image Details
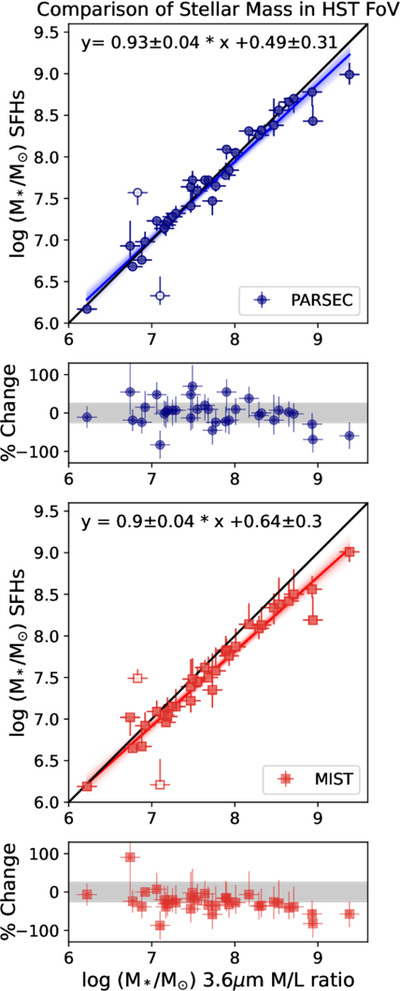
Caption: Figure 5.
Comparison of stellar masses and their relative change based on the 3.6 μm fluxes and assuming an M/L ratio with those derived from the CMD fitting using the PARSEC models (top two panels) and MIST models (bottom two panels) in matched FoV. For the mass comparison, we also show a line of unity (black) and the best-fitting line to the points, taking into account the uncertainties (line fits are given in the legends). Galaxies where the removal of contamination in the 3.6 μm imaging had higher uncertainties are shown as unfilled points and were not included in the line fits and are off the scale of the relative change plots. The shaded gray bands highlight ±25% in the relative change in masses using the 3.6 μm-based masses as a reference. The masses derived from these very disparate methods are in very good agreement with each other. The MIST models show a slight bias toward lower values relative to masses calculated from the 3.6 μm fluxes.
Other Images in This Article
Show More
Copyright and Terms & Conditions
© 2026. The Author(s). Published by the American Astronomical Society.

