

Image Details
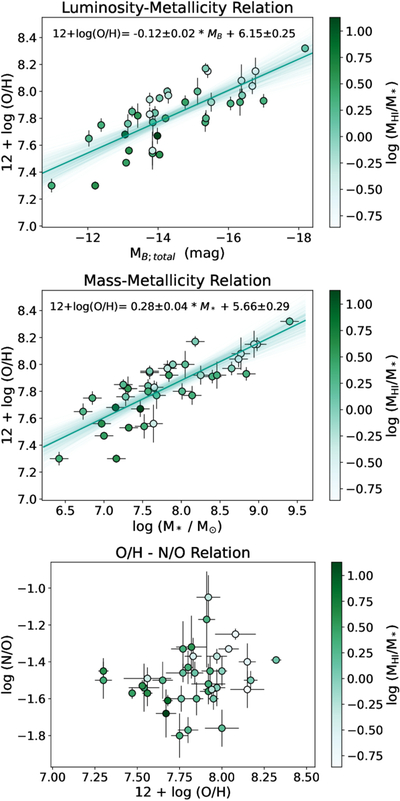
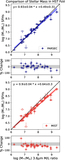
Caption: Figure 2.
LZ relation, MZ relation, and the log of the N/O abundances as a function of oxygen abundance for the GLOW sample. Points are color coded by the log of their MHI/M* ratios. Values of M* are based on the total 3.6 μm fluxes and adopting a mass-to-light ratio (see Section 4). Best-fitting lines (thicker line) and realizations within 1σ confidence intervals (thinner lines) are shown for the LZ and MZ relations.
Other Images in This Article
Show More
Copyright and Terms & Conditions
© 2026. The Author(s). Published by the American Astronomical Society.

Copyright ©
2026 Astronomy Image Explorer. All Rights Reserved.
