

Image Details
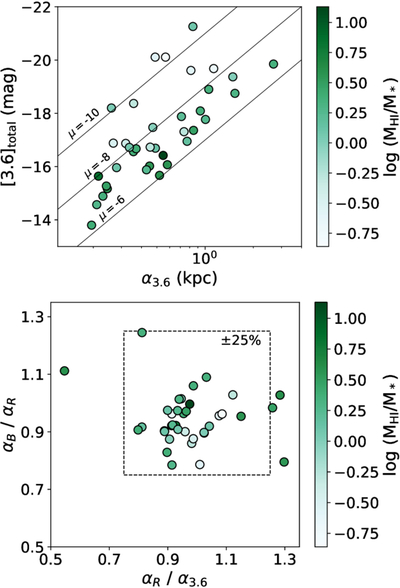
Caption: Figure 3.
Top panel: total 3.6 μm magnitudes as a function of scale length α. Diagonal lines present lines of constant surface brightness μ = −10, −8, −6 mag per arcsec2, from top to bottom, assuming the mean sample distance of 3.3 Mpc. The general trend is that larger galaxies are also brighter and more massive, as expected. Bottom panel: comparison of the ratios of B, R, and 3.6 μm scale lengths based on the cleaned images. The dashed box encompasses the points that agree within ±25%. While there are a few outliers, the overall good agreement between the ratios is an indication that the removal of contaminants from the imaging has not introduced significant biases when measuring the structural parameters of the galaxies, particularly since gradients in the stellar populations are expected. Points in both panels are color coded by the ratio of MHI/M*.
Other Images in This Article
Show More
Copyright and Terms & Conditions
© 2026. The Author(s). Published by the American Astronomical Society.

