

Image Details
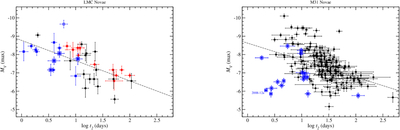
Caption: Figure 7.
Left panel: the MMRD plot for the LMC (blue points: He/N novae; red points: Fe II novae). Right panel: the MMRD plot for M31 (on the same scale) based on data from J. G. Clark et al. (2024). The large blue squares in both plots indicate known RNe. The dashed lines show the best linear fits with ﹩{M}_{V}=-8.77(\pm 0.26)+1.10(\pm 0.22)\,{\rm{log}}\,{t}_{2}﹩ and ﹩{M}_{V}=-8.62(\pm 0.21)+0.93(\pm 0.15)\,{\rm{log}}\,{t}_{2}﹩ for the LMC and M31, respectively.
Other Images in This Article
Show More
Copyright and Terms & Conditions
© 2026. The Author(s). Published by the American Astronomical Society.

Copyright ©
2026 Astronomy Image Explorer. All Rights Reserved.
