

Image Details
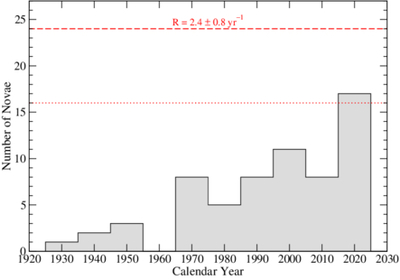
Caption: Figure 1.
The history of nova candidate discoveries in the LMC plotted in decade-wide bins from 1926 to 2025. The dashed red line shows the number of novae expected to erupt each decade (and its 1σ lower limit: dotted line) based on an estimated annual nova rate of 2.4 ± 0.8 yr−1 (P. Mróz et al. 2016a). It has not been until the past decade that the number of novae observed has exceeded ≳50% of the expected total.
Other Images in This Article
Show More
Copyright and Terms & Conditions
© 2026. The Author(s). Published by the American Astronomical Society.

Copyright ©
2026 Astronomy Image Explorer. All Rights Reserved.
