

Image Details
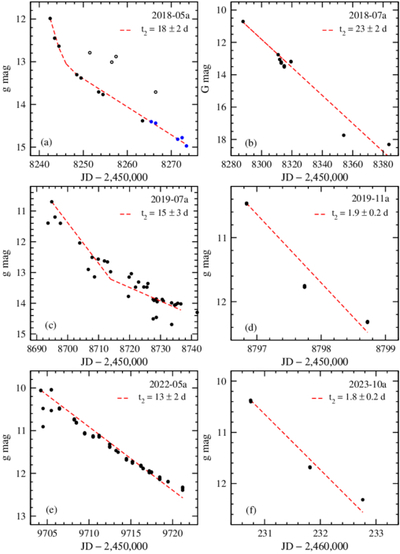
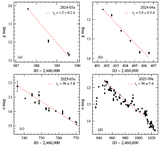
Caption: Figure 4.
Light curves for selected novae used for the determination of t2 times. (a) LMCN 2018-05a: R-band photometry from SMARTS (black points); I-band Gaia data (blue points). A two-component fit to data brighter than m = 15 yields an estimated t2 = 18 ± 2 days. (b) LMCN 2018-07a: a linear fit to Gaia photometry shows a 0.087 mag day−1 decline rate, corresponding to an estimated t2 = 23 ± 2 days. (c) LMCN 2019-07a: an initial decline rate of 0.132 ± 0.016 mag day−1 yields t2 = 15 ± 3. (d) LMCN 2019-11a: a linear fit to the limited ASAS-SN photometry suggests t2 = 1.9 ± 0.2 days. (e) LMCN 2022-05a: g-band light curve based on ASAS-SN data. The light declines at a rate of 0.15 mag day−1, corresponding to t2 = 13 ± 2 days. (f) LMCN 2023-10a: g-band photometry from the ASAS-SN survey showed the nova declined rapidly at a rate of 1.1 mag day−1, with t2 = 1.8 ± 0.2 days.
Other Images in This Article
Show More
Copyright and Terms & Conditions
© 2026. The Author(s). Published by the American Astronomical Society.

