

Image Details
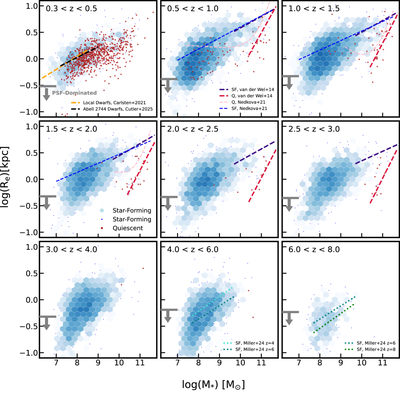
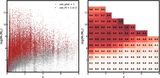
Caption: Figure 8.
The distribution in mass versus rest-frame optical size for galaxies with available measurements from this work binned by redshift. We show individual quiescent (“Q”) galaxies as red dots. For star-forming (“SF”) galaxies, we show their distributions as 2D histograms with blue hexagon bins. The darker bin color corresponds to higher source density. In bins containing fewer than three star-forming galaxies, we neglect binning and show them as individual blue dots. The star-forming galaxies and quiescent galaxies are separated by rest-frame ugi color criteria (J. Antwi-Danso et al. 2023). We mark the size regime where measured sizes are comparable to PSF widths with gray arrows in each panel. Several literature mass–size relations are plotted for comparison. In general, the mass–size distribution of galaxies in this work follows previous literature relations on the massive end. The galaxies in this work span an unprecedented range in mass, size, and redshift, enabling the characterization of the mass–size relation in a wider parameter space.
Other Images in This Article
Show More
Copyright and Terms & Conditions
© 2026. The Author(s). Published by the American Astronomical Society.

