

Image Details
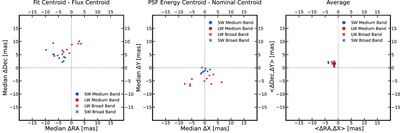
Caption: Figure 10.
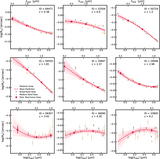
The left panel shows the median difference between the best-fitting Sérsic centroids and the flux centroids in each band in mas. The middle panel shows the difference between the PSF energy centroids and the PSF nominal centroids in each band in milliarcseconds. The right panel shows the average of the centroid offsets shown in the left and middle panels. It is likely the systematic subpixel centroid offsets in our fits are driven by the centroid offsets in PSFs, since the latter have similar amplitudes but opposite directions when compared to the former.
Other Images in This Article
Show More
Copyright and Terms & Conditions
© 2026. The Author(s). Published by the American Astronomical Society.

Copyright ©
2026 Astronomy Image Explorer. All Rights Reserved.
