

Image Details
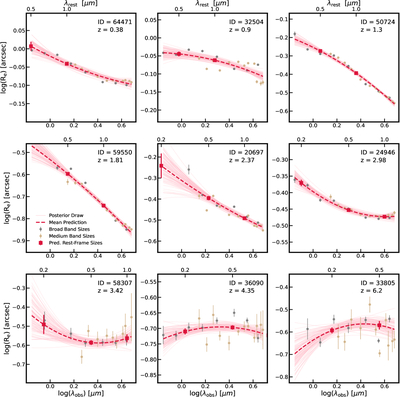
Caption: Figure 6.
Nine examples at z ∼ 0.3−8 whose observed sizes are fitted as a quadratic function of wavelength, from which we derive sizes at several rest-frame wavelengths. We show the observed sizes in brown (medium bands) or gray (broad bands) and rest-frame UV (0.2 μm), optical (0.5 μm), and infrared (1 μm) sizes in red. Pink lines represent the posterior draws from the fit, and the dashed red line represents the best-fitting size as a function of wavelength (corresponding to the mean of the posterior). Overall, our fitting method provides robust estimations and uncertainties of galaxy rest-frame sizes while being resilient to any outliers in the observed sizes. These fits also illustrate the diversity of color gradients in these galaxies.
Other Images in This Article
Show More
Copyright and Terms & Conditions
© 2026. The Author(s). Published by the American Astronomical Society.

