

Image Details
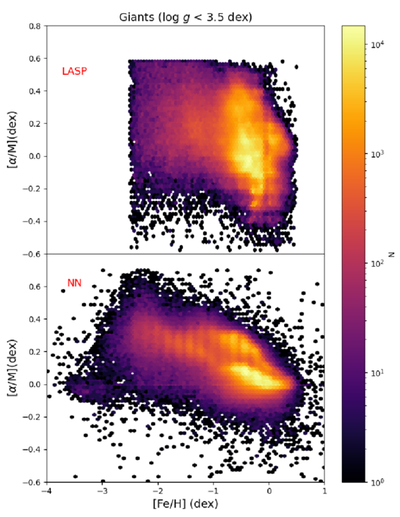
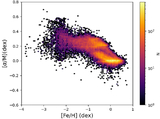
Caption: Figure 17.
[α/M] and [Fe/H] distributions for giant stars (log g < 3.5 dex) from LASP (top) and from the neural network (bottom). The points are color coded by the logarithm of their number density.
Other Images in This Article
Show More
Copyright and Terms & Conditions
© 2026. The Author(s). Published by the American Astronomical Society.

Copyright ©
2026 Astronomy Image Explorer. All Rights Reserved.
