

Image Details
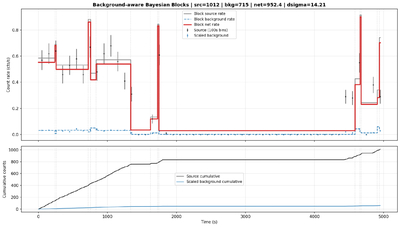
Caption: Figure 12.
Representative Bayesian Blocks diagnostic product for a flagged EP-WXT observation. The upper panel shows the block-wise source, background, and net count-rate behavior, while the lower panel shows the corresponding cumulative source and scaled background counts. This figure illustrates the standard interpretable output generated by Step 3 for manual inspection of candidate variable observations.
Other Images in This Article
Show More
Copyright and Terms & Conditions
© 2026. The Author(s). Published by the American Astronomical Society.

Copyright ©
2026 Astronomy Image Explorer. All Rights Reserved.
