Image Details
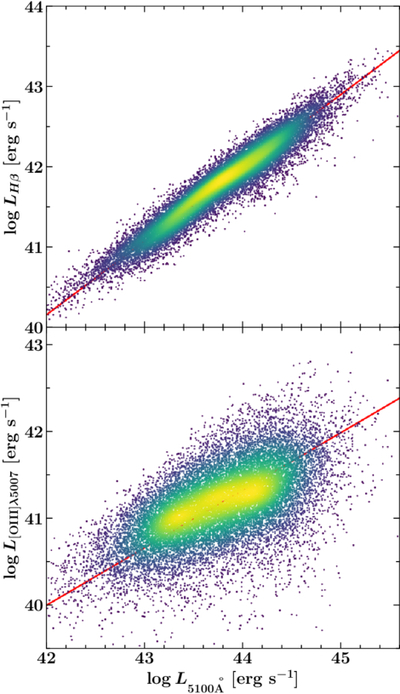
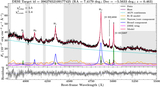
Caption: Figure 4.
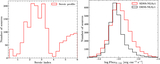
The variations of the luminosity of the Hβ and [O III] λ5007 emission lines and 5100 Å continuum luminosity are shown in these plots. The color scheme is based on the number density of sources, with lighter colors representing a larger number of sources. The red line refers to the best-fitted correlation.
Other Images in This Article
Copyright and Terms & Conditions
© 2026. The Author(s). Published by the American Astronomical Society.
Copyright ©
2026 Astronomy Image Explorer. All Rights Reserved.