Image Details
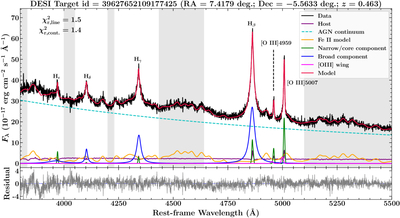
Caption: Figure 1.
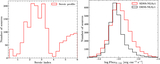
This plot shows an example of the spectral decomposition applied to the rest-frame DESI spectrum of an AGN. The model components are labeled, and several emission lines are marked. The vertical shaded regions refer to wavelength regions used for the continuum fitting.
Other Images in This Article
Copyright and Terms & Conditions
© 2026. The Author(s). Published by the American Astronomical Society.
Copyright ©
2026 Astronomy Image Explorer. All Rights Reserved.