Image Details
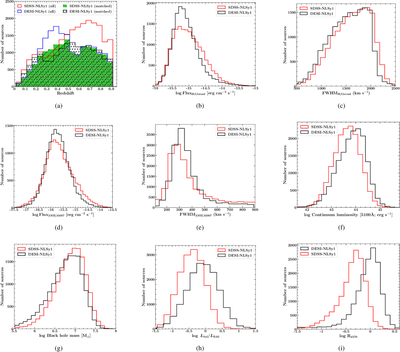
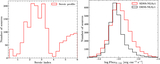
Caption: Figure 3.
These plots show the comparison of several parameters measured/derived from the optical spectroscopic analysis of SDSS-NLSy1 (red) and DESI-NLSy1 (black) galaxies.
Other Images in This Article
Copyright and Terms & Conditions
© 2026. The Author(s). Published by the American Astronomical Society.
Copyright ©
2026 Astronomy Image Explorer. All Rights Reserved.