

Image Details
A Wide and Deep Exploration of Radio-detected Active Galactic Nuclei with Subaru HSC (WERGS). XII. Final Optical Identification of VLASS Radio Sources from the Subaru/HSC-SSP Wide Survey over 1200 deg2
Hisakazu Uchiyama et al 2026 The Astrophysical Journal Supplement Series 285 .
- Provider: AAS Journals
Caption: Figure Figure 4.
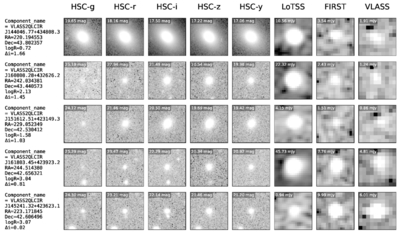
Multiwavelength cutout montage for five representative sources from the Clean VLASS-HSC-FIRST-LoTSS sample. Each row corresponds to one source, and the columns show the HSC g-, r-, i-, z-, and y-band images, followed by radio cutouts from LoTSS (144 MHz), FIRST (1.4 GHz), and VLASS (3 GHz). The HSC and VLASS panels are 10″ × 10″ cutouts, while the LoTSS and FIRST panels are 30″ × 30″ cutouts to better visualize the radio morphology in the lower-resolution radio images. All cutouts are centered on the HSC counterpart position. For the HSC bands, the overlaid label indicates the AB magnitude, while for the radio bands it indicates the integrated flux density in mJy. The left-hand annotation lists the VLASS component name, sky coordinates, radio loudness (logR; defined in Section 4.6), and optical extendedness (Δi; defined in Section 4.5) for each source.
Other Images in This Article
Show More
Copyright and Terms & Conditions
© 2026. The Author(s). Published by the American Astronomical Society.

