Image Details
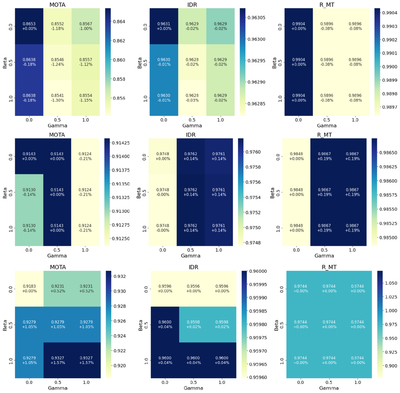
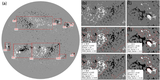
Caption: Figure 12.
The thermogram of the different evaluation indicators changes depending on the parameters β and γ. Take the lifetime threshold of the NOAA active regions to be 2. The first row corresponds to 2000–2002 (the maximum of solar cycle 23), the second row corresponds to 2003–2005 (the decay phase of solar cycle 23), and the third row corresponds to 2007–2009 (the minimum of solar cycle 23).
Other Images in This Article
Show More
Copyright and Terms & Conditions
© 2026. The Author(s). Published by the American Astronomical Society.
Copyright ©
2026 Astronomy Image Explorer. All Rights Reserved.