Image Details
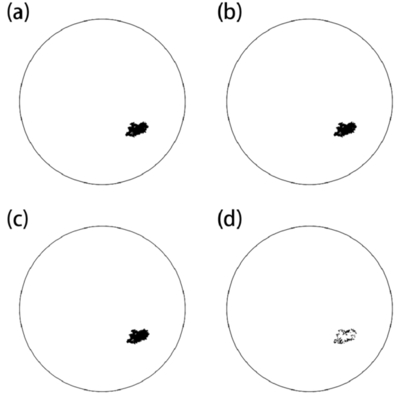
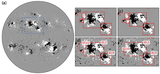
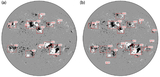
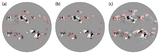
Caption: Figure 5.
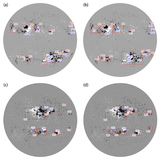
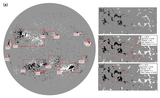
An example shows the entire procedure of Prediction and Match for a specific active region, AR2, in Figure 3(c), which is shown as the black area in the image. (a) The current position and shape of the AR. (b) The predicted position and shape of the AR at the next moment according to panel (a) and the time interval. (c) The detected position and shape of the AR at the next moment. (d) The difference between panels (b) and (c).
Other Images in This Article
Show More
Copyright and Terms & Conditions
© 2026. The Author(s). Published by the American Astronomical Society.
Copyright ©
2026 Astronomy Image Explorer. All Rights Reserved.