Image Details
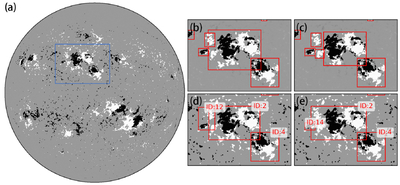
Caption: Figure 1.
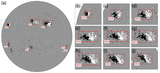
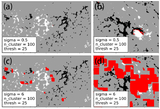
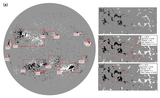
The DSARD result for the SOHO/MDI magnetogram on 2000 May 20, with minDistance set to 20 Mm and minSize set to 70 Mm2. (a) The result after threshold segmentation. The blue box area is the target region. The right panels are the result of the target region after each part of the DSARD processing. (b) Clustering results of the first global DBSCAN. (c) Clustering results of the second reformative DBSCAN. (d) Consequences of integration. (e) Better integration with β set to 0.5 and γ set to 0.5.
Other Images in This Article
Show More
Copyright and Terms & Conditions
© 2026. The Author(s). Published by the American Astronomical Society.
Copyright ©
2026 Astronomy Image Explorer. All Rights Reserved.