Image Details
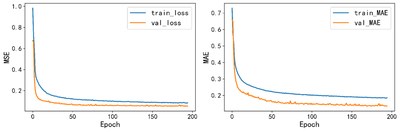
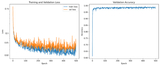
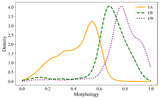
Caption: Figure 7.
Autoencoder training curves: loss and MAE versus training epochs. The left panel presents the training and validation loss curves, while the right panel shows the training and validation MAE curves.
Other Images in This Article
Copyright and Terms & Conditions
© 2026. The Author(s). Published by the American Astronomical Society.
Copyright ©
2026 Astronomy Image Explorer. All Rights Reserved.