Image Details
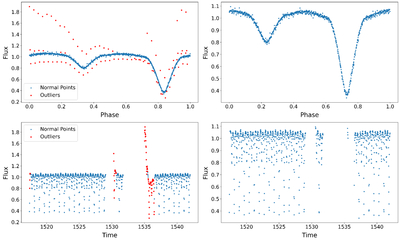
Caption: Figure 3.
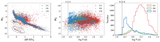
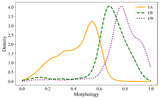
Data-denoising process of the light curve for TIC 391623240. The upper two panels display the denoising process in the phase domain, and the lower two panels show the corresponding results in the time domain. Blue dots represent valid retained data, while red dots represent the noise points removed during the denoising process.
Other Images in This Article
Copyright and Terms & Conditions
© 2026. The Author(s). Published by the American Astronomical Society.
Copyright ©
2026 Astronomy Image Explorer. All Rights Reserved.