

Image Details
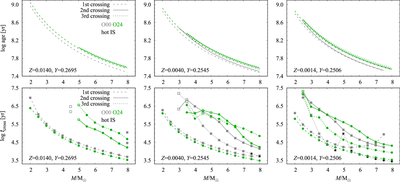
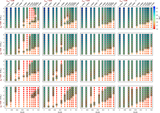
Caption: Figure 6.
The age at the entry of the IS (top) and crossing time through the IS (bottom) for models of different masses (horizontal axis) and metallicities (Z = 0.014, Z = 0.004, and Z = 0.0014 in the left, middle, and right columns, respectively). Data for O00 models (no overshooting) are plotted with gray, while data for O24 models (including core and envelope overshooting) are plotted in green. Different line styles correspond to different crossing numbers, as indicated in the legend. Determinations are based on the boundaries of hot IS.
Other Images in This Article
Show More
Copyright and Terms & Conditions
© 2026. The Author(s). Published by the American Astronomical Society.

Copyright ©
2026 Astronomy Image Explorer. All Rights Reserved.
