

Image Details
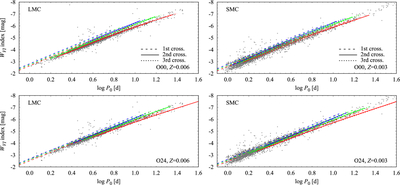
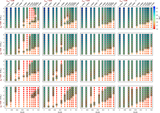
Caption: Figure 8.
Comparison of the observed and model P−L relations expressed in terms of the Wesenheit index, WVI, for the LMC (left) and SMC (right). OGLE data are compared to Z = 0.006 models (LMC) and Z = 0.003 (SMC) without overshooting (O00, top) and including overshooting (O24, bottom). Model relations are shown for the blue and red edges, and midline of the IS, with blue, red, and green colors, respectively. Relations for different crossings are plotted with different line styles, as indicated in the legend (relations for the second and third crossings largely overlap).
Other Images in This Article
Show More
Copyright and Terms & Conditions
© 2026. The Author(s). Published by the American Astronomical Society.

Copyright ©
2026 Astronomy Image Explorer. All Rights Reserved.
