Image Details
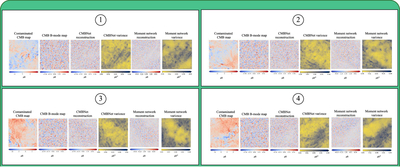
Caption: Figure 2.
Visualization of the reconstructed CMB B-mode mean maps and posterior variance maps. This figure presents, in sequence, the posterior distribution predictions obtained using CMBNet and the moment network on four independent test sets. For each set of test results, the images are displayed from left to right as follows: the contaminated CMB map, the clean CMB B-mode map, the reconstructed CMB B-mode mean map obtained using CMBNet, the posterior variance map obtained using CMBNet, the reconstructed CMB B-mode mean map obtained using the moment network, and the posterior variance map obtained using the moment network.
Other Images in This Article
Copyright and Terms & Conditions
© 2026. The Author(s). Published by the American Astronomical Society.