Image Details
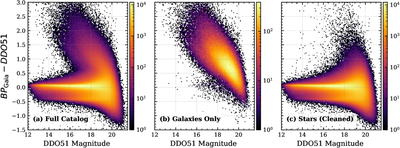
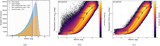
Caption: Figure 9.
Color–magnitude diagrams in the (BPgaia − DDO51) versus DDO51 plane. (a) Full sources with good quality and well matched with gaia. (b) Subsample of sources matched to the REGALADE galaxy catalog, with galaxy=True illustrating the locus occupied by galaxies. (c) Stellar sample obtained after removing the REGALADE-identified galaxies from the full catalog, yielding a cleaned stellar sequence. In all panels, the color scale indicates the logarithm of the number density of sources per bin.
Other Images in This Article
Show More
Copyright and Terms & Conditions
© 2026. The Author(s). Published by the American Astronomical Society.
Copyright ©
2026 Astronomy Image Explorer. All Rights Reserved.