Image Details
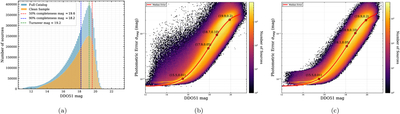
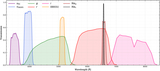
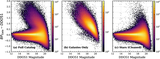
Caption: Figure 10.
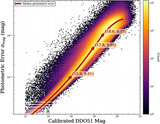
DDO51 photometric depth and precision of the merged catalog. (a) Histogram of DDO51 magnitudes for all sources and “clean” subsample in the final catalog, showing the number of objects per 0.1 mag bin. (b) Photometric uncertainty (σ) as a function of DDO51 magnitude for individual sources. The background is a two-dimensional histogram color coded by the logarithmic number of sources per bin, while the red curve traces the running median σ. The red circles mark the magnitudes at which the median uncertainty reaches ∼0.01, 0.05, and 0.10 mag. (c) Same as panel (b), but for the “clean” subsample after applying the quality cuts.
Other Images in This Article
Show More
Copyright and Terms & Conditions
© 2026. The Author(s). Published by the American Astronomical Society.