Image Details
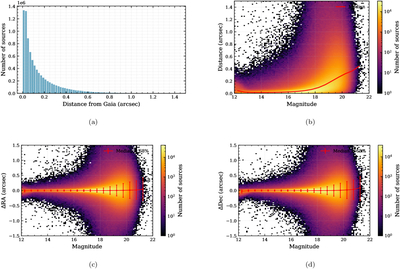
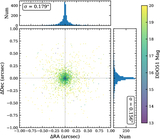
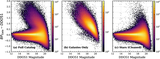
Caption: Figure 11.
Astrometric accuracy of the merged catalog relative to Gaia DR3. (a) Histogram of the angular separation between the merged source positions and the proper-motion-corrected Gaia coordinates in arcseconds. (b) Angular separation as a function of magnitude; the color scale shows the (logarithmic) number of sources per bin and the red curve traces the running median separation. (c) R.A. residuals (ΔR.A.) versus magnitude, color coded by source density; the red symbols with error bars indicate the median and the central 68% interval in each magnitude bin. (d) Same as (c), but for decl. residuals (Δdecl.).
Other Images in This Article
Show More
Copyright and Terms & Conditions
© 2026. The Author(s). Published by the American Astronomical Society.