Image Details
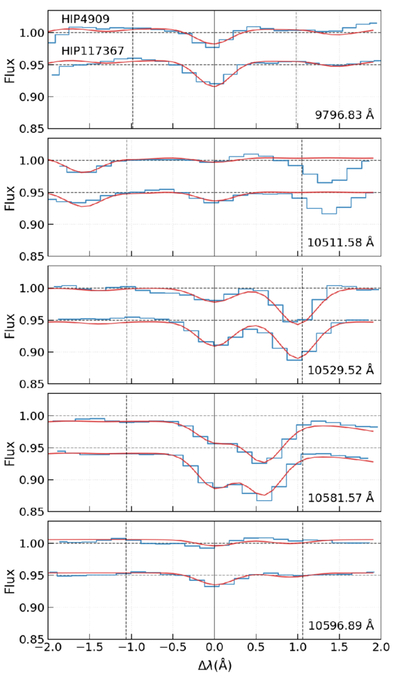
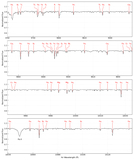
Caption: Figure 5.
Five P I lines we selected. Observed spectra are shown in blue, and the best-fitting synthetic spectra are shown in red for two solar analogs, HIP 4909 (upper) and HIP 117367 (lower). The solid vertical line marks the line center, and the dashed vertical lines indicate the fitting range (corresponding to ±30 km s−1).
Other Images in This Article
Copyright and Terms & Conditions
© 2026. The Author(s). Published by the American Astronomical Society.
Copyright ©
2026 Astronomy Image Explorer. All Rights Reserved.