Image Details
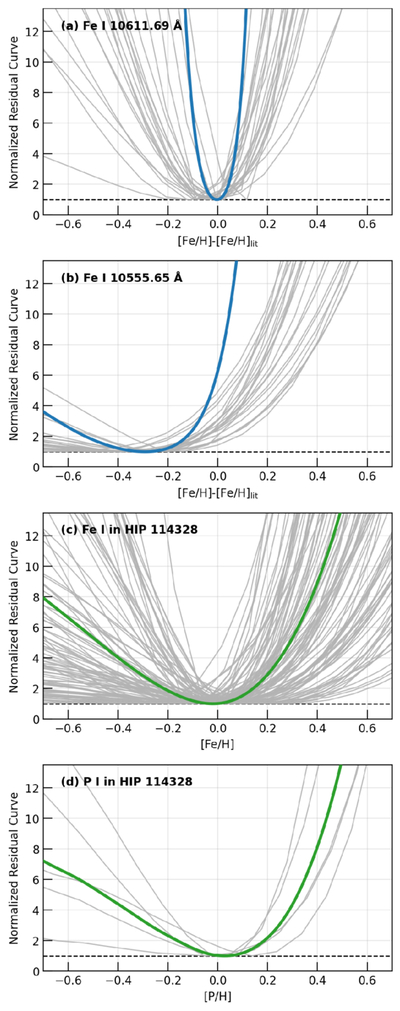
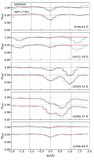
Caption: Figure 1.
Examples of residual curves. Panels (a) and (b) show the curves for Fe I 10611.69 Å and Fe I 10555.65 Å measured in solar-analog calibrators. Panels (c) and (d) show the target-stage combined residual curves for HIP 114328: Fe I in panel (c) and P I in panel (d). Gray curves are individual residual curves, while the thick blue/green curves are the combined residual curves. All curves are normalized to their minima for illustration.
Other Images in This Article
Copyright and Terms & Conditions
© 2026. The Author(s). Published by the American Astronomical Society.
Copyright ©
2026 Astronomy Image Explorer. All Rights Reserved.