Image Details
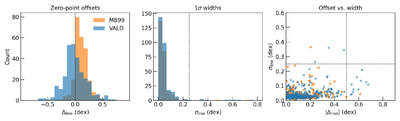
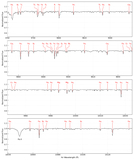
Caption: Figure 2.
Distributions of per-line zero-point offsets Δline and half-widths σline for candidate lines taken from VALD (blue) and those from MB99 (orange). Left panel: histograms of Δline. Center panel: histograms of σline. Right panel: ∣Δline∣ vs. σline. Most lines cluster around small offsets and narrow widths, while several lines were rejected due to large offsets (∣Δline∣ > 0.5) or half-widths (σline > 0.25).
Other Images in This Article
Copyright and Terms & Conditions
© 2026. The Author(s). Published by the American Astronomical Society.
Copyright ©
2026 Astronomy Image Explorer. All Rights Reserved.