Image Details
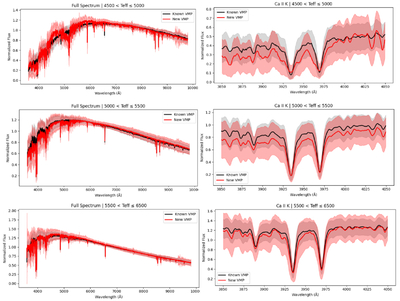
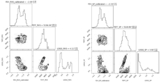
Caption: Figure 13.
Average normalized spectra of the VMP candidates, grouped by effective temperature (Teff). The black lines represent the “known VMP” reference sample (including literature crossmatches and DESI pipeline VMPs), while the red lines represent the “newly discovered VMP” candidates identified solely by our deep learning framework. The left column displays the full wavelength range, and the right column shows a zoomed-in view of the metallicity-sensitive Ca II K and H region (3850–4050 Å). Solid lines indicate the average flux of the respective samples, with the shaded regions indicating the 1σ dispersion.
Other Images in This Article
Show More
Copyright and Terms & Conditions
© 2026. The Author(s). Published by the American Astronomical Society.