Image Details
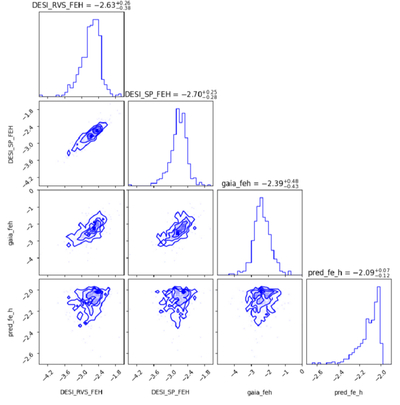
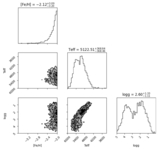
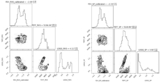
Caption: Figure 12.
Corner plot of metallicity estimates for the crossmatched VMP subsample (∼500 stars). Diagonal panels show the one-dimensional distributions of [Fe/H]RVS and [Fe/H]SP from the DESI RVS and SP pipelines, the metallicity [Fe/H]GaiaXP derived by L. Yang et al. (2025) from Gaia XP spectra, and the model-predicted [Fe/H]model, with the median and 16th/84th percentiles indicated in the panel titles. Off-diagonal panels display the corresponding two-dimensional distributions for each pair of metallicity estimates.
Other Images in This Article
Show More
Copyright and Terms & Conditions
© 2026. The Author(s). Published by the American Astronomical Society.
Copyright ©
2026 Astronomy Image Explorer. All Rights Reserved.