Image Details
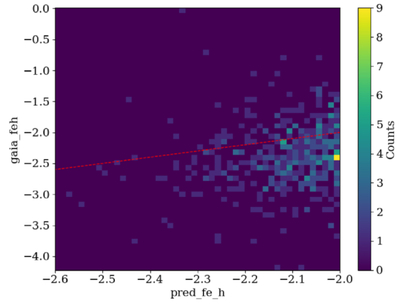
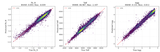
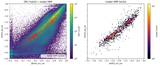
Caption: Figure 11.
Two-dimensional histogram of metallicity for the crossmatched VMP sample (∼500 stars), comparing the model-predicted [Fe/H]model (x-axis) with the metallicity [Fe/H]GaiaXP derived by L. Yang et al. (2025) from Gaia XP spectra (y-axis). Color indicates the number of stars in each bin, and the red dashed line shows the one-to-one relation (y = x).
Other Images in This Article
Show More
Copyright and Terms & Conditions
© 2026. The Author(s). Published by the American Astronomical Society.
Copyright ©
2026 Astronomy Image Explorer. All Rights Reserved.