Image Details
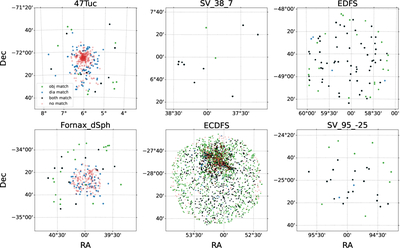
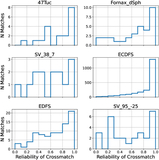
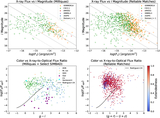
Caption: Figure 3.
Spatial distribution of all X-ray sources in the combined X-ray catalog. Matches to Objects are colored green. We also crossmatched diaObjects, which are detections based on difference_images. X-ray sources only detected in the DiaObject catalog are plotted in blue, and sources found in both catalogs are plotted in black. X-ray sources with no optical match in DP1 are plotted in red. Due to the crowdedness of the 47 Tuc and Fornax dSph fields, we have better success matching to the DiaObject table (see Section 4.4). Many of the unmatched sources are also in the cores of these two fields for the same reason.
Other Images in This Article
Copyright and Terms & Conditions
© 2026. The Author(s). Published by the American Astronomical Society.