Image Details
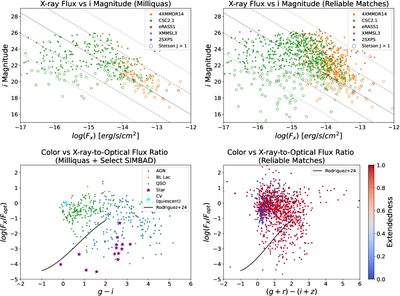
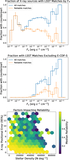
Caption: Figure 9.
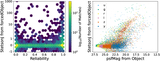
Top: On the left, we plot the X-ray flux vs i-band magnitude, only for objects with matches to the Milliquas catalog. The solid gray line delineates ﹩\mathrm{log}({F}_{{\rm{X}}}/{F}_{\mathrm{opt}})=0﹩, and the dashed and dotted lines are at log flux ratios of ±1 and ±2, respectively. Most of the X-ray bright galaxies fall between ±1, as expected for AGN. We expect many of the matches with ﹩\mathrm{log}({F}_{{\rm{X}}}/{F}_{\mathrm{opt}})\lt -1﹩ to be galaxies. The right plot shows all matches with reliability >90%, a total of 1344 Objects, on the same axes. The open circles show matches with some optical variability as defined by Stetson J; however, it appears there is a strong correlation between optical magnitude and Stetson J as mentioned previously. Bottom: We plot the X-ray-to-optical flux ratio against color. The left plot contains matches to Milliquas, plus some stars from SIMBAD and Gaia, and one CV (CRTS J033349.8-282244). The right plot again shows all matches with reliability >90% on the same axes. Extendedness measures whether the matched DP1 Object is pointlike (0) or extended (1). We use color transformations as defined in our Equation (7) to plot the empirical cut from A. C. Rodriguez (2024).
Other Images in This Article
Copyright and Terms & Conditions
© 2026. The Author(s). Published by the American Astronomical Society.