Image Details
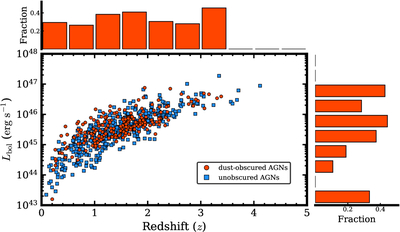
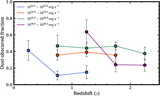
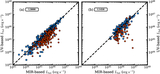
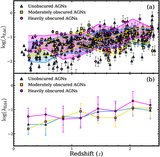
Caption: Figure 6.
Distributions of bolometric luminosity vs. redshift for dust-obscured and unobscured AGNs. Filled red circles and blue squares represent dust-obscured and unobscured AGNs, respectively. The top and right panels show the redshift and bolometric luminosity distributions of the dust-obscured fraction, respectively.
Other Images in This Article
Copyright and Terms & Conditions
© 2026. The Author(s). Published by the American Astronomical Society.
Copyright ©
2026 Astronomy Image Explorer. All Rights Reserved.