Image Details
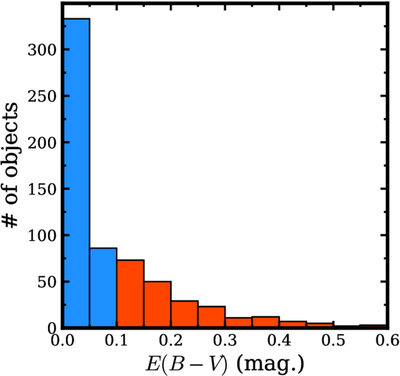
Caption: Figure 5.
Distribution of E(B − V) values derived from SED fitting. The blue and red histograms represent unobscured [E(B − V) ≤ 0.1] and dust-obscured [E(B − V) > 0.1] AGNs, respectively.
Other Images in This Article
Copyright and Terms & Conditions
© 2026. The Author(s). Published by the American Astronomical Society.
Copyright ©
2026 Astronomy Image Explorer. All Rights Reserved.