Image Details
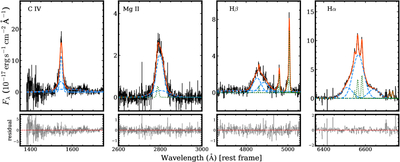
Caption: Figure 3.
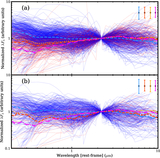
Examples of spectral fitting results for the C IV, Mg II, Hβ, and Hα line complexes. In the upper panels, the black lines show the rest-frame continuum-subtracted spectra. The dashed blue and dotted green lines represent the broad and narrow emission-line models, respectively, and the solid red lines indicate the combined best-fit model of the broad and narrow lines. The lower panels show the fitting residuals.
Other Images in This Article

Copyright and Terms & Conditions
© 2026. The Author(s). Published by the American Astronomical Society.
Copyright ©
2026 Astronomy Image Explorer. All Rights Reserved.