Image Details
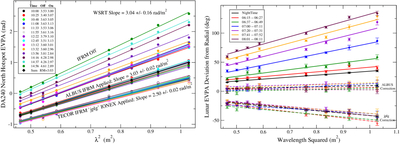
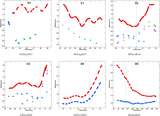
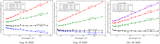
Caption: Figure 7.
Left panel: the observed and corrected EVPAs for DA240 for the “D2” observation by time. Shown are the uncorrected, and IFRM-corrected data for two estimates. Right panel: the same as the left panel, for the Moon. The colored solid lines show the fits to each observation taken after dawn. The black solid line is the fit for the night-time observations. The dashed lines show the fits following ALBUS corrections (shorter dashes) and “jplg” global (longer dashes).
Other Images in This Article
Show More
Copyright and Terms & Conditions
© 2026. The Author(s). Published by the American Astronomical Society.
Copyright ©
2026 Astronomy Image Explorer. All Rights Reserved.