Image Details
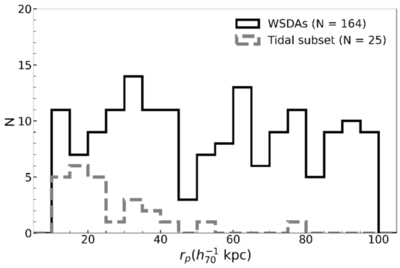
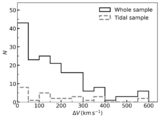
Caption: Figure 6.
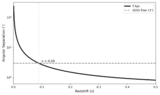
Distribution of projected distance (rp) for our dual AGNs. The black solid stepped histogram represents the full WSDA sample (N = 164), while the gray dashed stepped histogram corresponds to the tidal subset (N = 25).
Other Images in This Article
Show More
Copyright and Terms & Conditions
© 2026. The Author(s). Published by the American Astronomical Society.
Copyright ©
2026 Astronomy Image Explorer. All Rights Reserved.