Image Details
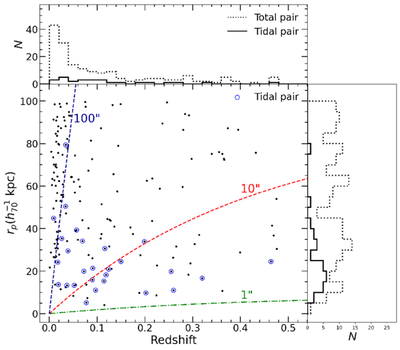
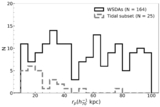
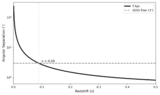
Caption: Figure 3.
Projected distance (rp) versus redshift for our dual AGNs. Black dots represent all dual AGNs, while blue circles represent dual AGNs with identified morphological tidal features identified in the optical images. The dotted histograms represent the distributions of the full dual-AGN sample, while the solid histograms show the distributions of the tidal sample. The green, red, and blue dashed lines correspond to angular separations of 1″, 10″, and 100″, respectively.
Other Images in This Article
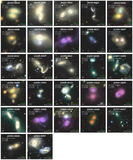
Show More
Copyright and Terms & Conditions
© 2026. The Author(s). Published by the American Astronomical Society.
Copyright ©
2026 Astronomy Image Explorer. All Rights Reserved.