Image Details
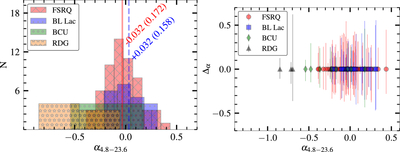
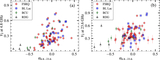
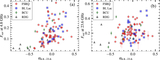
Caption: Figure 8.
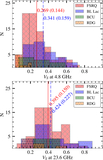
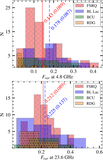
Histogram of average radio spectral index in the spectral region of 4.8–23.6 GHz (left panel). The transparent solid red and dashed blue vertical lines represent the average values with standard deviation inside parentheses for FSRQs and BL Lacs, respectively. The spread of spectral indices, estimated as the difference between maximum and minimum values in the region of 4.8–23.6 GHz, as a function of average spectral index (right panel).
Other Images in This Article
Show More
Copyright and Terms & Conditions
© 2026. The Author(s). Published by the American Astronomical Society.
Copyright ©
2026 Astronomy Image Explorer. All Rights Reserved.