Image Details
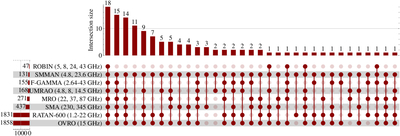
Caption: Figure 4.
UpSet plot describing the overlapping of the SMMAN sources with other monitoring programs. The horizontal set size bar chart displays the total number of sources within each distinct monitoring program. The vertical intersection size bar chart, positioned at the top, illustrates the number of sources of each particular intersection or combination of monitoring programs. The solid dots and lines (linked by a vertical line) signify the sources that belong to a particular intersection.
Other Images in This Article
Show More
Copyright and Terms & Conditions
© 2026. The Author(s). Published by the American Astronomical Society.
Copyright ©
2026 Astronomy Image Explorer. All Rights Reserved.