Image Details
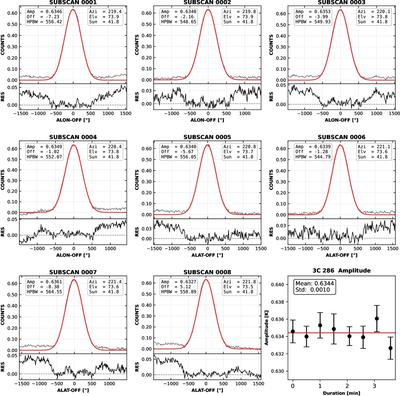
Caption: Figure 2.
Example of a 4 + 4 cross-scan observation of the calibrator source 3C 286 at 4.8 GHz. The first four subplots display longitude (azimuthal) subscans, followed by the next four showing latitude (elevational) subscans. For each of these eight subplots, the upper panel presents the subscan results, with the red curve representing the Gaussian fit model and the gray line indicating the actual observed data. The lower panel beneath each subscan plot shows the residuals of the model fit. The final subplot summarizes the fitted Gaussian amplitudes from all individual subscans, with a solid red horizontal line indicating the mean amplitude.
Other Images in This Article
Show More
Copyright and Terms & Conditions
© 2026. The Author(s). Published by the American Astronomical Society.