Image Details
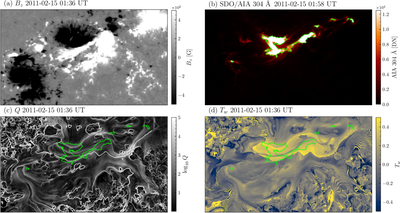
Caption: Figure 5.
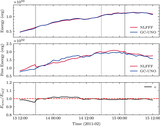
Comparison of results from GC-UNO with observation of the SDO/AIA 304 Å channel in AR 11158 during the X2.2 flare eruption. The top panels show the photospheric magnetic field z-component and the SDO/AIA 304 Å channel observations. The bottom panels show Q and Tw calculated using results of GC-UNO. The displayed Bz, Q, and Tw are at the preflare time 2011 February 15 01:36:00 UT, and the SDO/AIA observation is at the postpeak time 2011 February 15 01:58:00 UT. The green lines are the contour of DN = 7000.
Other Images in This Article
Copyright and Terms & Conditions
© 2026. The Author(s). Published by the American Astronomical Society.
Copyright ©
2026 Astronomy Image Explorer. All Rights Reserved.