Image Details
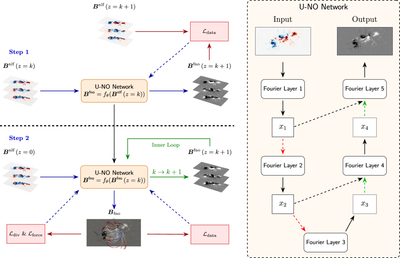
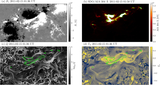
Caption: Figure 2.
Schematic of the GC-UNO architecture and the U-NO model. The U-NO is highlighted by a yellow box, and the loss functions are indicated by red boxes. NLFFF data are visualized using color maps, while the output from the U-NO is displayed in gray scale. The red dashed arrows represent downsampling of the data, the green dashed arrows denote upsampling, and the black dashed arrows indicate data concatenation.
Other Images in This Article
Copyright and Terms & Conditions
© 2026. The Author(s). Published by the American Astronomical Society.
Copyright ©
2026 Astronomy Image Explorer. All Rights Reserved.