Image Details
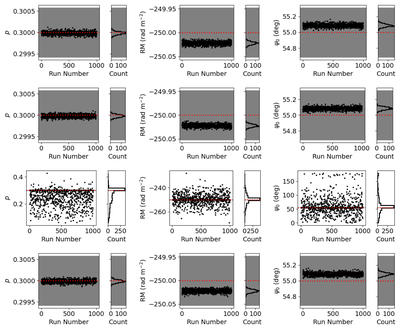
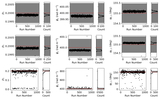
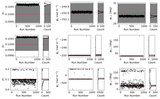
Caption: Figure 4.
Results of performing QU-fitting on the simulated Faraday simple source 1000 times. Each row represents a different nested sampling sampler used (top to bottom): dynesty, nestle, pymultinest, and ultranest, and the fitted parameters are divided into the three columns. The red dotted lines mark the parameters’ input values, and the gray shaded regions show the median output 1σ uncertainty.
Other Images in This Article
Copyright and Terms & Conditions
© 2026. The Author(s). Published by the American Astronomical Society.
Copyright ©
2026 Astronomy Image Explorer. All Rights Reserved.