Image Details
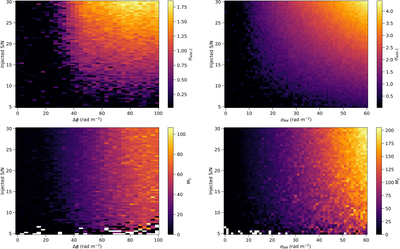
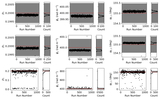
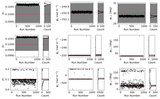
Caption: Figure 2.
Complexity metric values resulting from the uniform slab (left panels) or turbulent screen (right panels) models for different S/N and Faraday thickness values. The complexity metrics shown are σadd,C (top row) and M2 (bottom row). Each pixel was derived from a single polarized spectrum realization, so inter-pixel variations indicate the influence of spectral noise on the resulting metric value. Blank (white) values in the M2 plots occur occasionally at low S/N when the resulting FDF contains no samples above the CLEAN threshold and, thus, no clean components with which to compute the second moment.
Other Images in This Article
Copyright and Terms & Conditions
© 2026. The Author(s). Published by the American Astronomical Society.
Copyright ©
2026 Astronomy Image Explorer. All Rights Reserved.