Image Details
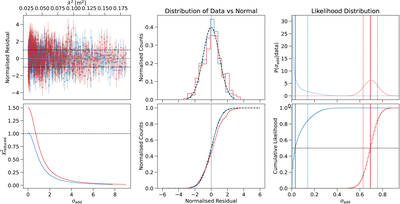
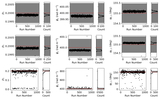
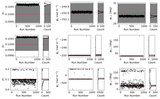
Caption: Figure 1.
Top-left panel: residual q/σq and u/σu spectra of a simple (blue) and complex (red) source after a Faraday thin model derived from RM-synthesis has been subtracted. Dashed lines show the ±1σ limits. Bottom-left panel: reduced χ2 as a function of σadd. Values <1 indicate that modeling the residuals with this much σadd would make the uncertainties inconsistently large compared to the data. Middle column: the probability density distribution (top) and cumulative density (bottom) of the residual spectra, as compared to a normal distribution (black dashed line). A wider distribution here is an indication of unmodeled structure in the residuals. Right column: marginal posterior probability distributions for the additional scatter term σadd. Solid vertical lines show the mean of the distribution, and dashed vertical lines show the ±1σ values. The simple source is best modeled with a very small σadd value (consistent with zero), while the complex source requires a larger value.
Other Images in This Article
Copyright and Terms & Conditions
© 2026. The Author(s). Published by the American Astronomical Society.