Image Details
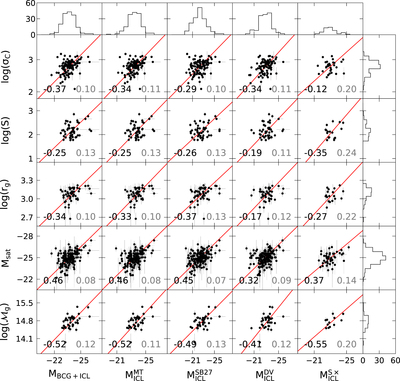
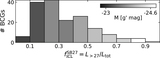
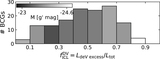
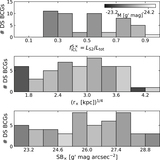
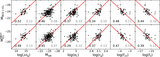
Caption: Figure 12.
Correlations between BCG/ICL parameters (horizontal) and cluster parameters (vertical). The columns show (1) the absolute brightness of the BCGs+ICL MBCG+ICL [g′ mag], the absolute brightness of the ICL only MICL[g′ mag], dissected (2) via the total magnitude threshold of −21.85 g′ mag ﹩{M}_{\mathrm{ICL}}^{\mathrm{MT}}﹩, (3) via the surface brightness threshold of 27 g′ mag ﹩{M}_{\mathrm{ICL}}^{\mathrm{SB}27}﹩, (4) via the light excess above the inner de Vaucouleurs fit ﹩{M}_{\mathrm{ICL}}^{\mathrm{DV}}﹩, and (5) via the double Sérsic fit ﹩{M}_{\mathrm{ICL}}^{{\rm{S}}\times }﹩. The methods are explained in Section 5. The rows show (1) the velocity dispersion of the satellite galaxies σC [km s−1] (taken from Lauer et al. 2014), (2) richness S, that is, number of satellite galaxies, (3) gravitational radius rg [kpc], (4) integrated absolute brightness of all satellite galaxies (excluding the BCG+ICL) Msat [g′ mag], and (5) gravitational mass ﹩{{ \mathcal M }}_{{\rm{g}}}[{M}_{\odot }﹩]. The Pearson coefficient for each correlation is given as a black label and its error (calculated using 10,000 bootstraps) as a gray label. The histograms show the number of data points in each bin from the subplot containing either Msat or MBCG+ICL.
Other Images in This Article

Show More
Copyright and Terms & Conditions
© 2021. The American Astronomical Society. All rights reserved.