Image Details
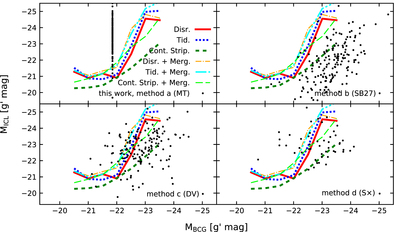
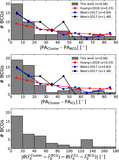
Caption: Figure 8.
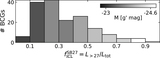
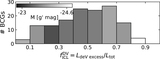
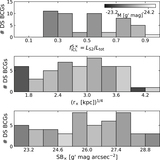
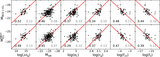
Comparison between our photometrically determined BCG vs. ICL brightnesses (black points) and predictions from semianalytic models (Contini et al. 2014): disruption model (red line), tidal radius model (blue dotted line), continuous stripping model (green dashed line), and the same models including the merger channel. All models are summarized in Section 5.5. The different BCG/ICL decomposition methods for our observational data are (a) the integrated brightness threshold, (b) the surface brightness threshold at ﹩{\mathrm{SB}}_{\mathrm{cut}}=27\,g^{\prime} ﹩ mag arcsec−2, (c) the de Vaucouleurs fit + excess light, and (d) the double Sérsic decomposition. The methods are detailed in Section 5. The sample from Contini et al. (2014) also includes lower-mass clusters (﹩{{ \mathcal M }}_{200}\gt {10}^{13}{M}_{\odot }﹩), located toward the left, which we do not test with our data. In order to convert the stellar masses from Contini et al. (2014) to g′-band luminosities, we assume a constant mass-to-light ratio of 4.5 times solar in the g′ band (Tang et al. 2018).
Other Images in This Article

Show More
Copyright and Terms & Conditions
© 2021. The American Astronomical Society. All rights reserved.